Good Conversion Rate for Sales? Benchmarks + How to Improve
The average ecommerce conversion rate is 2.9%, but top performers hit 5%+. Get realistic benchmarks by industry and traffic source, plus ways to improve.
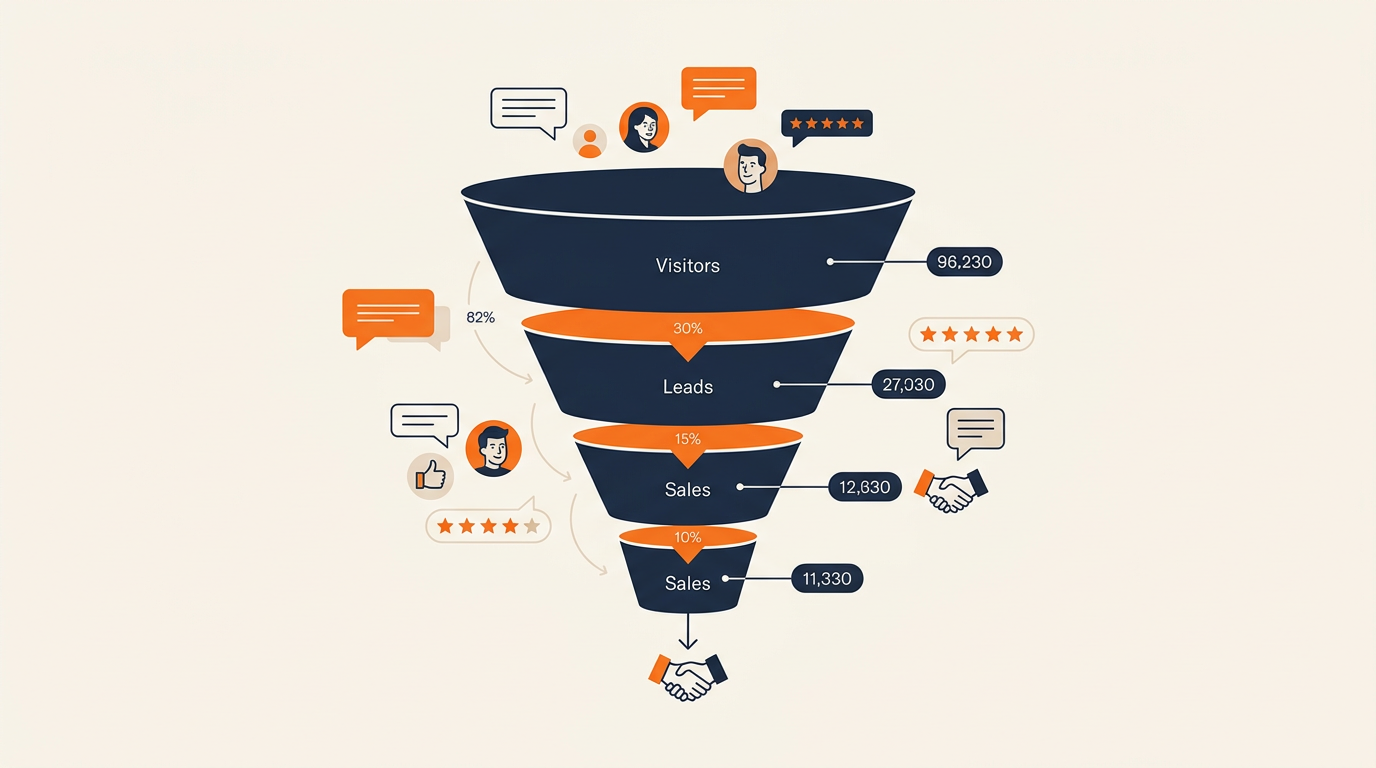
Your conversion rate for sales is just the percentage of people who show up and actually buy. Forget the noise. This is the one number that tells you if your marketing and sales are making real money or just generating clicks. Testimonials directly move this number -- adding them to sales pages lifts conversions by up to 34% because they close the trust gap that stops visitors from buying.
TL;DR: The average ecommerce conversion rate is 2.9% (Dynamic Yield, 2025), but that number is almost meaningless without context. Food and beverage stores convert at 6.2% while luxury sits below 1%. Your traffic source matters even more: referral traffic converts at 5.4%, while social media limps along at 0.7%. Stop chasing a universal benchmark. Establish your own baseline by industry and channel, then improve it every month.
Everyone Is Lying About Their Conversion Rate
A "good" conversion rate is completely relative. Most of those sky-high rates you see on social media or hear about at conferences are cherry-picked, stripped of context, or just made up. Fixating on a single number like the often-quoted 2.5% to 3% ecommerce average (Shopify, 2026) is a mistake. That number means nothing without context.
Why Context Is Everything
Think about it. A 1% conversion rate could be phenomenal for a B2B SaaS company selling $50,000 annual contracts. But 10% might be a failure for an ecommerce store pushing $15 t-shirts with a hyper-targeted ad campaign. The number alone tells you almost nothing.
What actually matters for your business:
- Your Industry: Selling professional services is nothing like selling phone cases.
- Your Price Point: Way easier to get someone to buy a $20 product than a $2,000 one.
- Your Traffic Source: A visitor from a trusted referral is primed to buy. Someone who clicked a random social media ad? Not so much.
- The Specific Action: Are you measuring free trial sign-ups or actual paying customers? Those are very different things.
Your goal isn't to hit some arbitrary industry benchmark. It's to establish your own baseline and then relentlessly focus on improving it, month after month. That's how you build a scalable business.
Your sales conversion rate tells you how well you're turning interest into income. It shows what's working and what isn't. Get this right and you have a foundation for predictable growth. Get it wrong and you're guessing.
How to Actually Calculate Your Sales Conversion Rate
Divide sales by visitors or leads, multiply by 100. That's it. The hard part isn't the math. It's knowing what you should be measuring in the first place.
The formula:
(Number of Sales / Number of Leads or Visitors) x 100 = Sales Conversion Rate
If 1,000 people landed on your pricing page last month and 20 became paying customers, your conversion rate is 2%. Simple enough. But that top-level number is a vanity metric. Nice to know, but it doesn't tell you anything you can act on.
The Real Insights Are in Segmentation
A single, blended conversion rate hides the truth. Your job is to break it down and see what's actually moving the needle. Blending all your traffic into one bucket is like trying to figure out your bestselling product by only looking at total store revenue. Useless.
Here's where the useful data lives:
- By Channel: What's the conversion rate from organic search versus your paid Google ads? If organic traffic converts at 4% and paid ads convert at 0.5%, you know exactly where your marketing is hitting home.
- By User Segment: How do new visitors convert compared to returning visitors? A low conversion rate for new visitors might point to a weak first impression or a confusing value proposition.
- By Offer: Don't lump a "free trial sign-up" with a "demo request." They have different levels of intent. Calculating the conversion rate for each tells you which call-to-action is more effective at generating paying customers down the line.
My take: If you're not segmenting your conversion rate, you're flying blind. You can't fix a problem you can't see, and a single aggregate number hides every problem and opportunity in your funnel.
A Quick Example Calculation
Say an ecommerce store selling custom coffee mugs had 10,000 visitors last month and made 200 sales.
- Overall Conversion Rate: (200 sales / 10,000 visitors) x 100 = 2%
Now, let's segment that traffic:
- Instagram Ads: 5,000 visitors, 50 sales. Conversion Rate = 1%
- Email Newsletter: 2,000 visitors, 100 sales. Conversion Rate = 5%
- Organic Search: 3,000 visitors, 50 sales. Conversion Rate = 1.67%
See the difference? Your email list is a money-printing machine. Your Instagram ads need a serious overhaul. Now you know where to focus.
Common Pitfalls I've Seen
The math is easy. But I've seen plenty of teams make decisions based on bad data because they fell into a few traps.
The biggest one? Using the wrong denominator. Make sure you're comparing apples to apples. If you're measuring the conversion rate from a lead to a sale, your denominator should be the number of qualified leads, not total website visitors. Using total visitors will artificially deflate your rate and make your sales team's performance look worse than it is.
Another killer is inaccurate conversion tracking. If your analytics goals aren't set up correctly or you're not properly attributing sales to the right channels, the numbers you calculate are pure fiction. Double-check your setup before you start making any strategic moves based on the data.
Finding a Realistic Sales Conversion Rate Benchmark
2.9% is the average ecommerce conversion rate globally (Dynamic Yield, 2025). But comparing your B2B tech company to a DTC t-shirt brand makes no sense. Your industry, price point, and sales cycle completely change what a healthy conversion rate looks like.
Conversion Rates by Industry
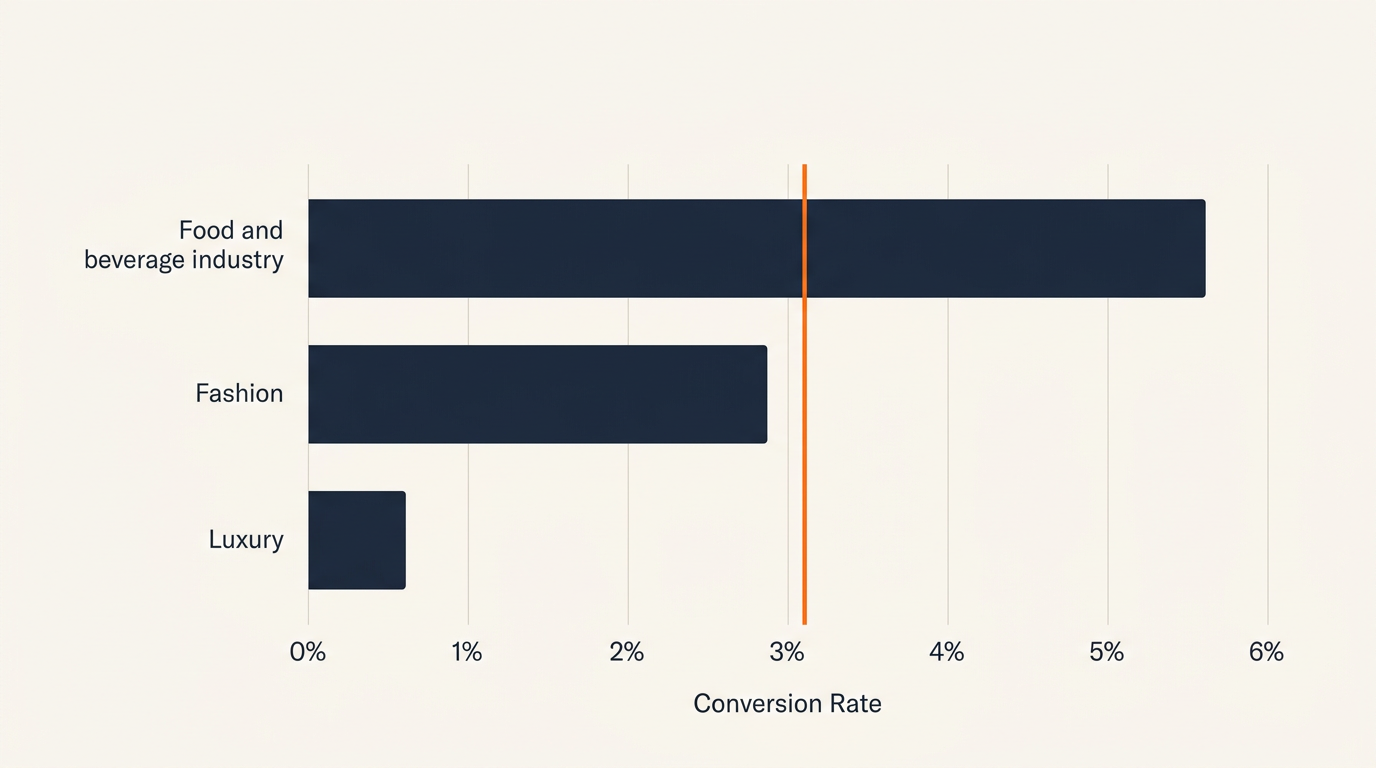
The global average hovers between 2.5% and 3% (Shopify, 2026). Useful as a starting point, but dig deeper and it's a mess of averages. Food and beverage hits 6.22% thanks to impulse buys. Luxury goods sits below 0.94% because nobody impulse-buys a $5,000 watch (Shopify / Dynamic Yield, 2026).
| Industry | Average Conversion Rate | Source |
|---|---|---|
| Food & Beverage | 6.22% | Shopify / Dynamic Yield, 2026 |
| Beauty & Personal Care | 4.94% | Dynamic Yield, 2025 |
| Multi-Brand Retail | 3.93% | Dynamic Yield, 2025 |
| Pet Care & Veterinary | 3.28% | Dynamic Yield, 2025 |
| Fashion & Apparel | 3.06% | Dynamic Yield, 2025 |
| Consumer Goods | 2.85% | Dynamic Yield, 2025 |
| Home & Furniture | 1.41% | Dynamic Yield, 2025 |
| Luxury & Jewelry | 0.94% | Shopify / Dynamic Yield, 2026 |
This is why broad averages are misleading. If you sell luxury watches and see that 6.22% food and beverage number, you'd think you're failing. In reality, your lower rate is normal for a product with a much longer buying decision.
Teams that compare themselves to their own industry vertical instead of the global average make far better decisions. Industry-segmented benchmarks are the only ones worth looking at.
Conversion Rates by Traffic Source Tell the Real Story
Where your traffic comes from has a massive impact on whether it converts. Treating all traffic the same is a mistake.
| Traffic Source | Avg. Conversion Rate | Source |
|---|---|---|
| Referral | 5.4% | Red Stag Fulfillment, 2026 |
| 5.3% | Red Stag Fulfillment, 2026 | |
| Direct | 2.2% | Red Stag Fulfillment, 2026 |
| Organic Search | 2.1% | Red Stag Fulfillment, 2026 |
| Paid Search | 1.4% | Red Stag Fulfillment, 2026 |
| Social Media | 0.7% | Red Stag Fulfillment, 2026 |
Referral and Email: The High-Trust Channels
Referral traffic leads the pack at 5.4% (Red Stag Fulfillment, 2026). When a potential customer arrives from a source they already trust, that trust transfers to you. It's the digital version of a warm introduction.
Key finding: Email and referral traffic convert roughly 7x better than social media (Red Stag Fulfillment, 2026). That gap alone should change how you allocate your marketing budget.
Organic and Direct: The Intent Channels
Organic Search & Direct Traffic are your high-intent visitors. They're actively looking for a solution like yours and convert in the 2% to 3% range.
Social Media: Great for Awareness, Terrible for Sales
Traffic from social media converts at 0.7% on average. People are on Instagram to scroll, not to buy. Great for awareness. Terrible for direct sales.
Stop pouring money into channels that don't convert. Double down on the ones that do. Building partnerships for referrals or investing in social proof will almost always deliver a better return than another social media ad campaign.
Finding Your True Benchmark
So how do you find the right benchmark? Combine industry data with channel data. Top-performing Shopify stores convert at 3.2% or higher, putting them in the top 20% of all Shopify merchants (Littledata, 2023). Referral traffic can convert at over 5% because it runs on trust. Social proof isn't a buzzword here. It's a real revenue driver.
Your most important benchmark is your own past performance. If your conversion rate was 1.5% last quarter and it's 1.8% this quarter, that's a win. Consistent improvement beats chasing some industry number. For more strategies, check our blog.
The Hidden Killers Destroying Your Conversion Rate
It's rarely the big, dramatic website crash that kills your sales. It's the small stuff. Tiny moments of friction, confusion, and doubt that cause thousands of potential customers to quietly click away.
Forget the obvious advice like "make your site faster." Of course you should. But the real damage usually comes from something deeper: people don't understand your value, or they don't trust you to deliver on it. Either way, they won't buy.
The Friction Fallacy
Most businesses think of friction as a slow page load. I think of it as any moment that makes a buyer pause and think, "Is this worth the effort?" Every unnecessary form field, every confusing nav link, every vaguely worded button is friction.
I once worked with a SaaS company that saw a 30% drop in demo requests. The cause? A designer added a "Company Size" dropdown menu to the form with 15 different options. That one tiny change was enough to make busy prospects give up. We simplified it back to three options, and the leads returned.
Here's my take: Your checkout and sign-up process should be brutally simple. Every single step you ask a customer to take costs you conversions. Your job is to remove as many of those steps as humanly possible.
Your Value Proposition Is Weaker Than You Think
You're too close to your product. You think its value is obvious, but to a first-time visitor, it's probably a confusing mess of jargon and feature lists. If someone can't figure out what problem you solve within five seconds, you've lost them.
A confusing value proposition forces the visitor to do the work. They have to decipher your messaging instead of immediately seeing how you solve their problem. Be clear. Be direct. Talk about their pain, not your features.
The Trust Gap: The Ultimate Conversion Killer
This is the big one. If a potential customer feels any uncertainty, they're gone. The "trust gap" is the space between interest and willingness to buy. Without trust signals, that gap is a canyon.
What creates it?
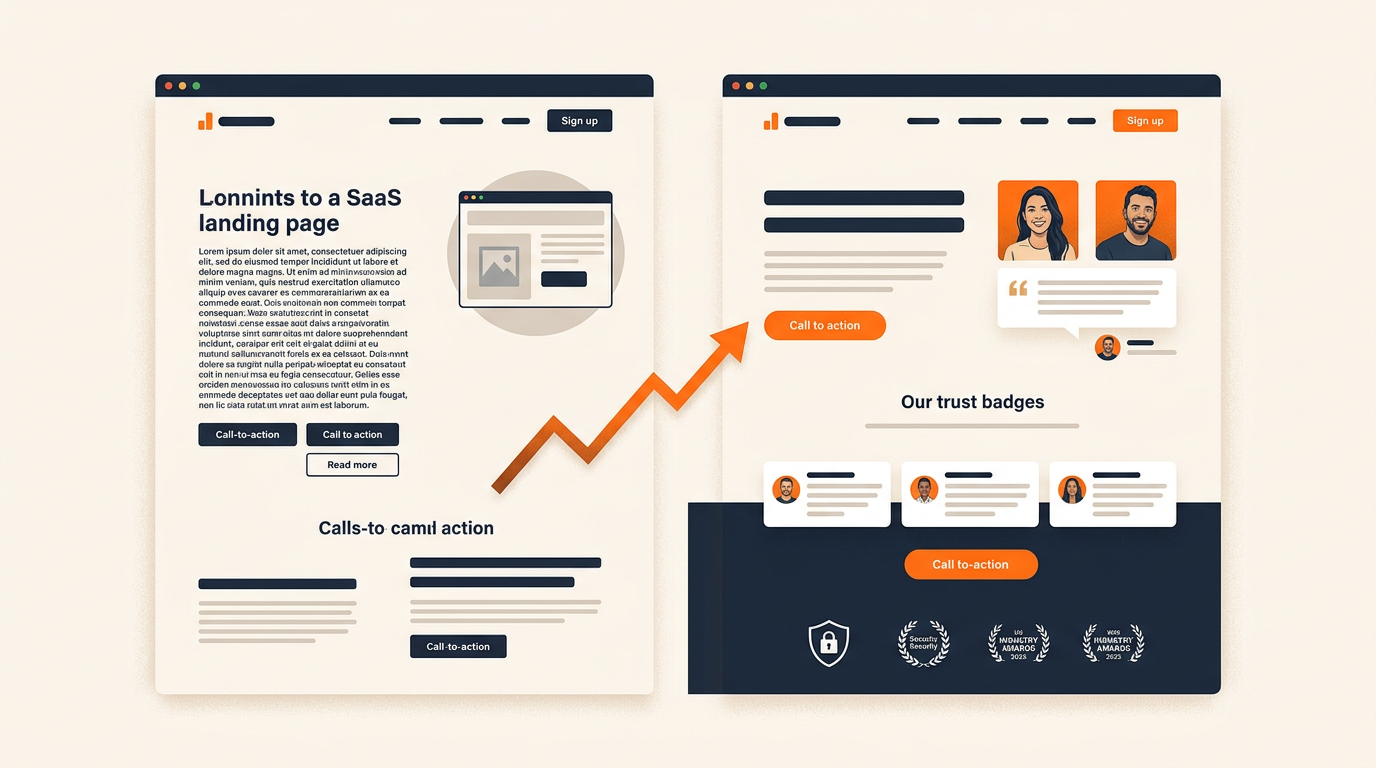
- No social proof: A landing page with zero testimonials feels empty. It says "no one else has bought this" without saying it.
- Vague promises: Generic fluff like "the best solution" instead of specific outcomes.
- Hidden pricing: Making people jump through hoops to see what it costs is an immediate red flag.
Key finding: Referral traffic, which runs on pre-established trust, converts at 5.4% — nearly 8x higher than social media at 0.7% (Red Stag Fulfillment, 2026).
This is why closing the trust gap is your most important job.
Think about your own buying behavior. You look for reviews, ask for recommendations, seek out proof. Your customers do the same thing. You can build that trust by showing what happy customers are saying with a Wall of Love. For display ideas, see our testimonial display examples guide. No proof on your page isn't neutral. It's working against you.
Actionable Strategies to Boost Your Sales Conversion Rate
The three biggest levers for conversion rate are clarity, simplicity, and trust. In that order. Most companies overcomplicate this, chasing dozens of tiny tweaks while massive holes in their strategy stay wide open. Get the fundamentals right and you'll see a bigger impact than a hundred minor A/B tests.
Nail Your Offer and CTA
This sounds basic, but it's the most common failure point I see. Your offer needs to be clear, and your call-to-action (CTA) needs to be impossible to miss. If a visitor spends even a few seconds guessing what you sell or what they should do next, you've lost them.
- Clarify Your Offer: Ditch the jargon. "We provide synergistic B2B solutions" says nothing. "We find you 50 qualified leads in 30 days" solves a specific problem.
- Strengthen Your CTA: "Learn More" and "Submit" are dead CTAs. No energy, no reason to click. "Get Your Free Demo" or "Start My Free Trial" tell the visitor what they're getting.
Test your headlines and CTAs relentlessly. This is one of the few areas where A/B testing gives you clean, immediate feedback. A small change in wording can absolutely lead to a significant lift.
Simplify Everything
Friction kills conversions. Every extra step, every unnecessary form field, every moment of confusion costs you sales. Your goal: make the path from "interested" to "customer" as short as possible.
Just think about Amazon's one-click checkout. They built an entire empire by obsessively removing friction.
Here's a challenge: Go through your own checkout or signup process right now. For every single field you ask for, demand an answer to this question: "Do I absolutely need this information right now, or am I just being greedy?" If you don't need it, kill it.
A shorter form will almost always outperform a longer one. I've seen companies double their lead conversions just by cutting form fields in half. Don't ask for a phone number if you only plan to email them. Don't ask for company size if you're not using it for segmentation right now. Respect their time.
Turn Social Proof into Your Ultimate Salesperson
Clarity gets them interested. Simplicity keeps them moving. But none of it matters if they don't trust you. This is where social proof becomes your most powerful conversion tool.
But slapping a few random quotes on your site isn't a strategy. It's decoration. A real approach means putting the right testimonial in front of the right person at the right time. The social proof statistics back this up.
The average conversion rate for sales across all industries is 2.9% (Dynamic Yield, 2025). The trust gap is a big reason why. Social proof is what closes it.
Automate and Amplify Your Testimonials
Manually collecting and posting testimonials is slow, inefficient, and you'll never keep it up to date. You need a system that runs without you babysitting it.
Here's how a tool like Credibly can turn this chore into a conversion engine:
- Automate the Ask: The best time to ask for feedback is right after a customer has a win. Credibly lets you automate testimonial requests based on triggers in your CRM or after they give you a positive NPS score. This creates a constant flow of fresh, authentic feedback without you lifting a finger. And if you're stuck on what to say, you can use our free tool to generate high-converting testimonial request emails.
- Surface the Best Quotes with AI: Not all testimonials are created equal. Credibly uses AI sentiment analysis to pinpoint the most persuasive quotes that speak directly to customer pain points. It can tag testimonials with keywords like "easy to use" or "great support," so you can perfectly match the proof to the page.
- Display Dynamically, Without Code: Imagine a pricing page that automatically shows testimonials from visitors in the same industry. Or a feature page that highlights quotes specifically about that feature. With Credibly's dynamic widgets, you can embed these smart collections with a single line of code, ensuring the social proof is always relevant and powerful. For ideas on building one that converts, see our guide on building a wall of love that converts.
This isn't about showing off quotes. It's about building an automated trust system. You stop guessing what prospects want to hear and start showing them proof from people like them. That's how you climb from a stagnant 2% conversion rate toward the 5%+ range that top companies hit.
Key Takeaways
Here's the short version of what matters:
- The "average" is misleading. The global ecommerce conversion rate is 2.9%, but rates range from 0.94% (luxury) to 6.22% (food and beverage). Benchmark against your own industry vertical.
- Your traffic source matters more than your industry. Referral traffic converts at 5.4% while social media converts at 0.7%. Shift budget toward high-trust channels.
- Trust is the #1 conversion driver. The gap between referral and social traffic is almost entirely a trust gap. Close it with strategic social proof and customer testimonials.
- Segment or stay blind. A blended conversion rate hides your biggest problems and your biggest opportunities. Break it down by channel, offer, and audience.
- Improve against yourself. Your most important benchmark is last quarter's number. Consistent, incremental growth beats chasing industry averages.
Frequently Asked Questions
Now for the questions I hear most often about conversion rates.
How often should I track my sales conversion rate?
Don't check it every day. Daily numbers swing wildly for no real reason, and you'll panic over statistical noise.
Weekly or monthly is the right cadence. A weekly check gives you enough data to spot real trends without overreacting to one bad day. Do a deeper review once a month for strategic decisions.
The exception: short-term campaigns like a 72-hour flash sale. Then daily tracking makes sense.
What's the difference between a lead and sales conversion rate?
People mix these up constantly, and it causes real confusion. They measure different parts of your funnel, and you need both.
-
A lead conversion rate tracks how many visitors become leads -- someone filling out a form, downloading an ebook, signing up for a webinar. Top of funnel. Tells you how well your marketing captures interest.
-
A sales conversion rate measures how many leads become paying customers. Bottom of funnel. Directly tied to revenue.
High lead conversion + low sales conversion is a classic broken funnel. Your marketing is writing checks your sales process can't cash.
It's simple: getting leads is great, but getting sales is what keeps the lights on. If you have a ton of leads but no sales, you have a very expensive hobby, not a business.
Can a high conversion rate ever be a bad thing?
Yes. A sky-high conversion rate can actually be a red flag.
It might mean your prices are too low. You're converting easily because you're a bargain, but you're leaving money on the table with every sale.
Or you're only attracting a tiny audience. If your demo page has a 50% conversion rate but gets 10 visitors a month, that's not success. That's a marketing problem.
The goal isn't just a high number. It's a healthy number from a steady stream of qualified traffic that leads to profitable growth.
Which traffic source has the highest conversion rate?
Referral traffic, no contest. Visitors from a trusted source like a review site or partner blog convert at 5.4%, crushing every other channel (Red Stag Fulfillment, 2026).
It comes down to trust. When someone lands on your site through a warm introduction, that trust transfers to your brand. They show up ready to believe you.
This is why customer testimonials matter so much. They mimic referral psychology at scale. After referrals, email traffic converts at 5.3%, followed by organic search and direct traffic -- both high-intent channels where the visitor is already looking for a solution like yours.
Ready to turn your happy customers into your best sales channel? Credibly automates testimonial collection, management, and display so you can build trust and lift your conversion rate without the manual grind.
Written by Credibly Team
We help businesses collect and display customer testimonials that actually convert. No awkward asks. No scattered screenshots. Just social proof that works.
Try Credibly FreeAlso comparing tools? Explore testimonial software alternatives.
Continue Reading
Ecommerce Testimonial Examples: 11 Brands Doing It Right
Real ecommerce testimonial examples from 11 brands driving sales with reviews. Products with 5+ reviews are 270% more likely to sell. Tactics included.
How to Collect Testimonials: Build a System That Scales
72% of customers leave reviews when asked, yet most businesses collect zero. Build a testimonial collection engine with proven timing, channels, and automation
SaaS Testimonial Examples: 11 Companies Doing It Right
See how 11 SaaS companies use testimonials to boost conversions by up to 34%. Real examples with steal-worthy tactics and data-backed strategies inside.